Using Reference Tracing to Detect Memory Leaks
Reference Tracing logs every allocation and de-allocation and this can be very useful in detecting memory leaks. In this example we will deliberately create a memory leak and see how this is detected in the log file.
Creating a Memory Leak
The pymemtrace.cMemLeak has a number of classes that can create a memory demand.
The reference count of these objects can be manipulated directly and so we can cause a leak.
For example using pymemtrace.cMemLeak.CMalloc:
from pymemtrace import cMemLeak

obj = cMemLeak.CMalloc(1024)
obj.inc_refcnt(1)
By incrementing the reference count we have prohibited the Python runtime from ever de-allocating the object. A memory leak.
Lets create a function that creates a number of these objects and, optionally, leaks them.
from pymemtrace import cMemLeak

def create_tmp_list_of_memory_objects(cause_leak: bool):
    l = []
    for i in range(4):
        obj = cMemLeak.CMalloc(1024)
        # Choose to leak or not.
        if cause_leak:
            obj.inc_refcnt(1)
        l.append(obj)
    while len(l):
        l.pop()
Using Reference Tracing
Firstly with no leak:
from pymemtrace import cPyMemTrace

with cPyMemTrace.ReferenceTracing(
        include_tp_names=['cMemLeak.CMalloc',],
) as profiler:
    create_tmp_list_of_memory_objects(cause_leak=False)
This creates a log file that we can analyse with pymemtrace.util.ref_trace_analyse:
File path: 20260419_120519_0_71199_O_0_PY3.13.2.log
2026-04-19 13:05:37,142 - ref_trace_analyse.py#338 - INFO     - Lines: 12 NEW: 4 DEL: 4 NEW - DEL: 0 MSG: 0
Initial Message:
test_reference_tracing_deliberate_leak_to_cwd(): Class: CMallocObject Leak: False
Untracked Objects [0]:
Type                                        Count
Live Objects [0]:
Previous Objects [4]:
    0x6000034c1f90 cMemLeak.CMallocObject                   NEW: test_cpymemtrace.py#818 DEL: test_cpymemtrace.py#823
    0x6000034c2550 cMemLeak.CMallocObject                   NEW: test_cpymemtrace.py#818 DEL: test_cpymemtrace.py#823
    0x6000034c25d0 cMemLeak.CMallocObject                   NEW: test_cpymemtrace.py#818 DEL: test_cpymemtrace.py#823
    0x6000034c2690 cMemLeak.CMallocObject                   NEW: test_cpymemtrace.py#818 DEL: test_cpymemtrace.py#885
Type count [1]:
Type                                          New      Del  New - Del
cMemLeak.CMallocObject                          4        4          0
Process time: 0.001 (s)
This shows that the four objects were allocated and then de-allocated correctly.
Now with a leak:
from pymemtrace import cPyMemTrace

with cPyMemTrace.ReferenceTracing(
        include_tp_names=['cMemLeak.CMalloc',],
) as profiler:
    create_tmp_list_of_memory_objects(cause_leak=True)
And this log file analysed with pymemtrace.util.ref_trace_analyse gives:
$ python pymemtrace/util/ref_trace_analyse.py 20260419_120519_1_71199_O_0_PY3.13.2.log
File path: 20260419_120519_1_71199_O_0_PY3.13.2.log
2026-04-19 13:05:55,774 - ref_trace_analyse.py#338 - INFO     - Lines: 8 NEW: 4 DEL: 0 NEW - DEL: 4 MSG: 0
Initial Message:
test_reference_tracing_deliberate_leak_to_cwd(): Class: CMallocObject Leak: True
Untracked Objects [0]:
Type                                        Count
Live Objects [4]:
    0x6000034c4090    4 cMemLeak.CMallocObject                   create_tmp_list_of_memory_objects test_cpymemtrace.py#818
    0x6000034c4110    4 cMemLeak.CMallocObject                   create_tmp_list_of_memory_objects test_cpymemtrace.py#818
    0x6000034c4290    4 cMemLeak.CMallocObject                   create_tmp_list_of_memory_objects test_cpymemtrace.py#818
    0x6000034c4390    4 cMemLeak.CMallocObject                   create_tmp_list_of_memory_objects test_cpymemtrace.py#818
Previous Objects [0]:
Type count [1]:
Type                                          New      Del  New - Del
cMemLeak.CMallocObject                          4        0          4
Process time: 0.001 (s)
And that shows that the four objects are still ‘alive’.
Whilst Reference Tracing can not pinpoint where a missing de-allocation should be it can certainly narrow down what types are not being de-allocated correctly.
Plotting Memory and Live Count
The script pymemtrace.util.ref_trace_analyse has an option to plot with
gnuplot the RSS usage and the object count over time.
This gives a visual view of memory usage and object allocation over time.
This uses the --gnuplot-path for specifying the path for the
gnuplot output and --gnuplot-types to provide a comma seperated
list of types of interest.
Here is an example of a Python program reading ten geophysical data
files and writing a HTML summary file for each.
A message (MSG:) containing the file name is inserted into the log file for every read and write.
The Python code is instrumented with pymemtrace thus:
# Various imports here...

from pymemtrace import cPyMemTrace
from pymemtrace import cpymemtrace_decs

@cpymemtrace_decs.reference_tracing(message="LASToHTML",)
def las_file_to_html(las_file_path: str, html_file_path: str) -> None:
    """Reads and parses a LAS file and writes a summary to a HTML file."""
    # Mark the log file with a message to say we are starting the read.
    # This will be rendered as a label on the plot.
    cPyMemTrace.reference_tracing_write_message_to_log(
        f'Read LAS File "{os.path.basename(las_file_path)}'
    )
    # Read and parse the LAS file.
    las_file = LASRead.LASRead(las_file_path)
    # Mark the log file with a message to say we are starting the write.
    # This also will be rendered as a label on the plot.
    cPyMemTrace.reference_tracing_write_message_to_log(
        f'Write HTML "{os.path.basename(html_file_path)}'
    )
    # Write the HTML summary of las_file.
    write_html(las_file: LASRead.LASRead, html_file_path: str)
As well as using the pymemtrace.cpymemtrace_decs.reference_tracing()
decorator for each file we write a message to the log when reading the
input and another when writing the output.
These messages will be converted to labels on the resulting plot of memory usage.
The decorator produces a 2GB log file with nearly 10m lines.
The script pymemtrace.util.ref_trace_analyse can be used to analyse this log file.
It is invoked by giving a gnuplot output directory and a list of types of interest.
These types are LASRead which is the internal representation of the parsed file,
this contains a list of LASSection objects and XhtmlStream is the means
by which the HTML output is created:
$ python pymemtrace/util/ref_trace_analyse.py \
    20260606_105231_0_23826_O_0_PY3.13.13.log \
    --gnuplot-path=gnuplot_ref_trace \
    --gnuplot-types=LASRead,LASSection,XhtmlStream
pymemtrace.util.ref_trace_analyse takes around 70s to
analyse this log file and write the following files to
the gnuplot output directory:
20260606_105231_0_23826_O_0_PY3.13.13.log.dat
20260606_105231_0_23826_O_0_PY3.13.13.log.plt
20260606_105231_0_23826_O_0_PY3.13.13.log.png
The .dat file contains the time series data with
one column for each type and the RSS.
The .plt file contains a best effort of the gnuplot
configuration file.
This can be hand edited to improve the plot which can be rebuilt
with gnuplot -p <.plt file>.
The plot looks like this:
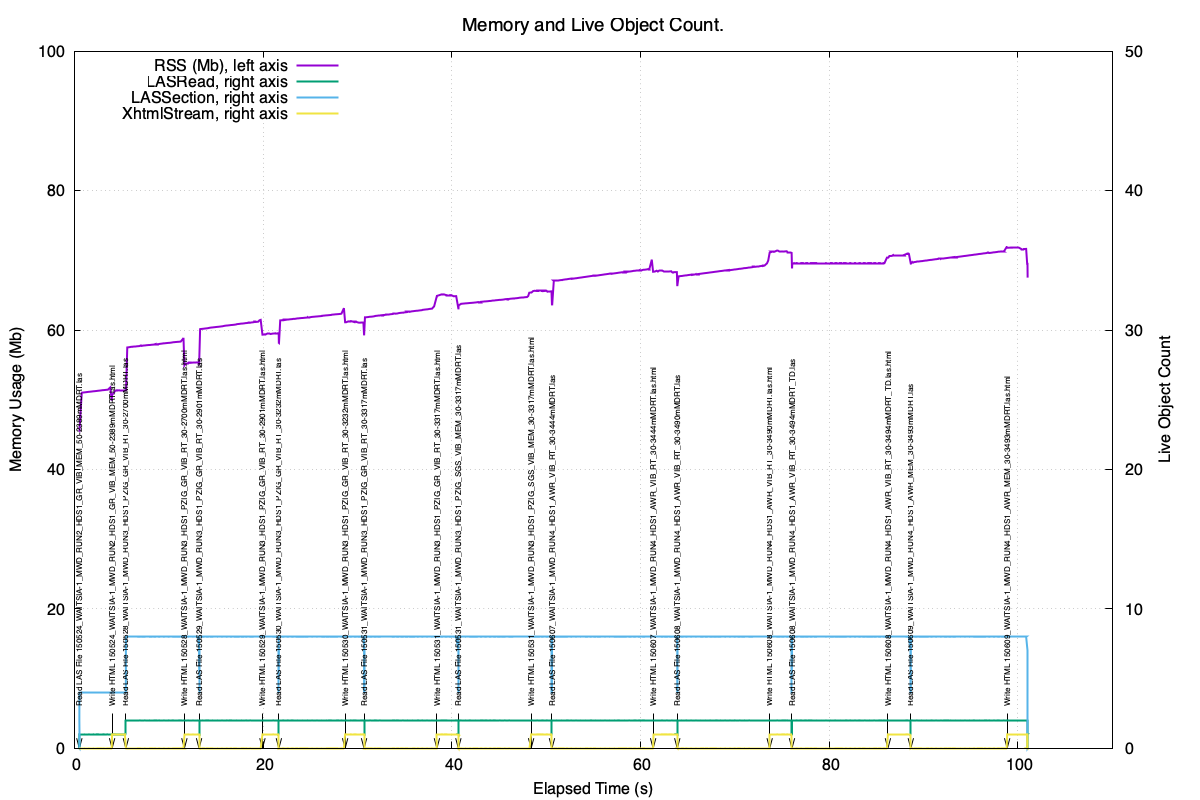
This shows the behaviour of the code, it looks pretty healthy, the RSS is (mostly) reclaimed. Because of the way that Python’s small object memory allocator works it is quite usual to see the RSS slowly creep up during the lifetime of the process so this looks quite normal.
Importantly the live object count is moderate and as we would expect, ten LASRead
objects have been created and all are de-allocated by the end of the log.
With a Memory Leak
Now we deliberately introduce a memory leak in the LASRead object.
This is done by increasing the reference count so that the object,
and all the objects it contains, are never de-allocated.
from pymemtrace import cMemLeak

# Code as above...
las_file = LASRead.LASRead(las_file_path)
# Increment the reference count so that las_file is never deallocated.
cMemLeak.py_incref(las_file)
# Continue the code as above...
Now the the plot looks distinctly different:
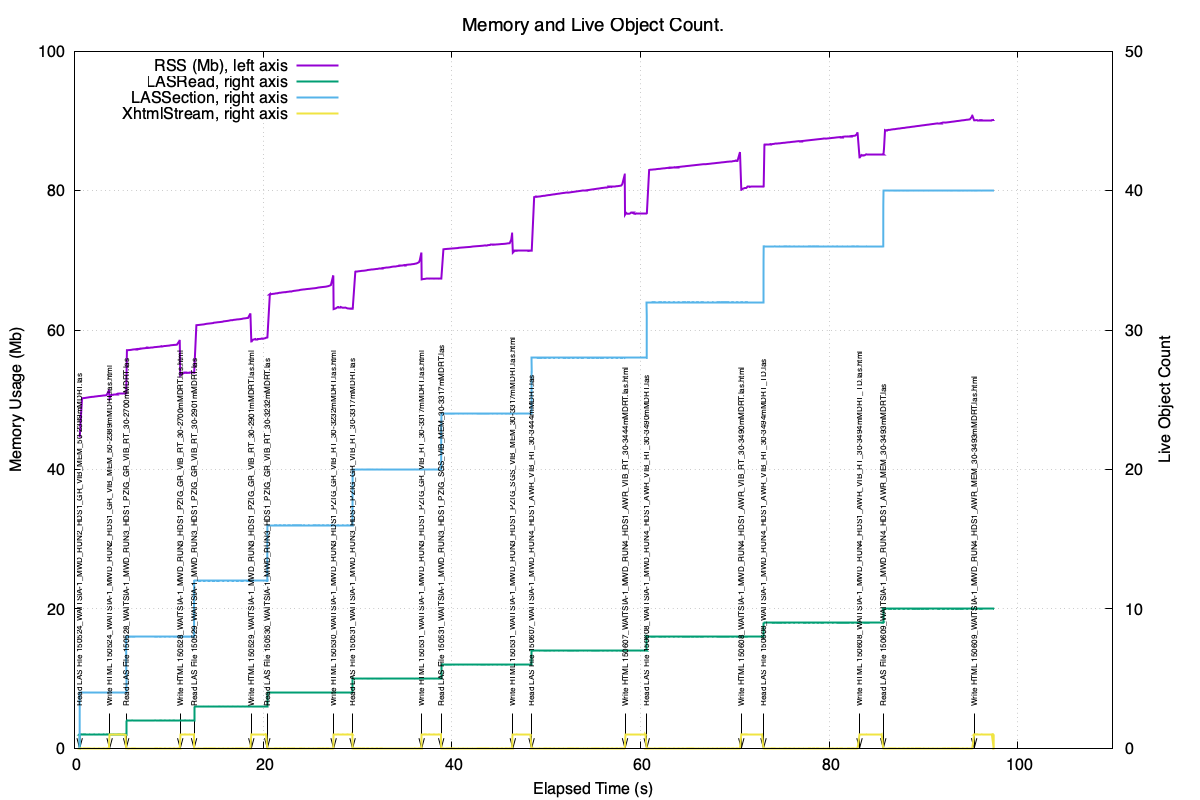
The RSS increases as usual so it is hard to see that there is a memory leak.
However the live object count of LASRead and LASSection,
which are ever increasing, makes it clear that those objects are
not being de-allocated.
This makes it far easier to track down that memory leak.
Instrumenting your code like this gives you a forensic view of its memory behaviour.