process_tree Examples
process_tree is a very lightweight way of recording the total memory usage at regular time intervals and reporting
the progress of a process and all its children.
Example Target
Here is a code example simplified from pymemtrace/examples/ex_process_tree.py which spawns several processes each of
which repeatedly creates and destroys large strings:
import random
import time
import multiprocessing

def sub_process(task_id: int) -> int:
    ret = 0
    for alloc in range(8):
        str_len = random.randint(128 * 1024**2, 1024**3)
        string = ' ' * str_len
        ret += len(string)
        time.sleep(0.75 + random.random())
        del string
        time.sleep(0.25 + random.random())
    return ret


def run_processes():
    with multiprocessing.Pool(processes=8) as pool:
        result = [
            r.get()[0] for r in [
                pool.map_async(sub_process, [t, ]) for t in range(8)
            ]
        ]


if __name__ == '__main__':
    run_processes()
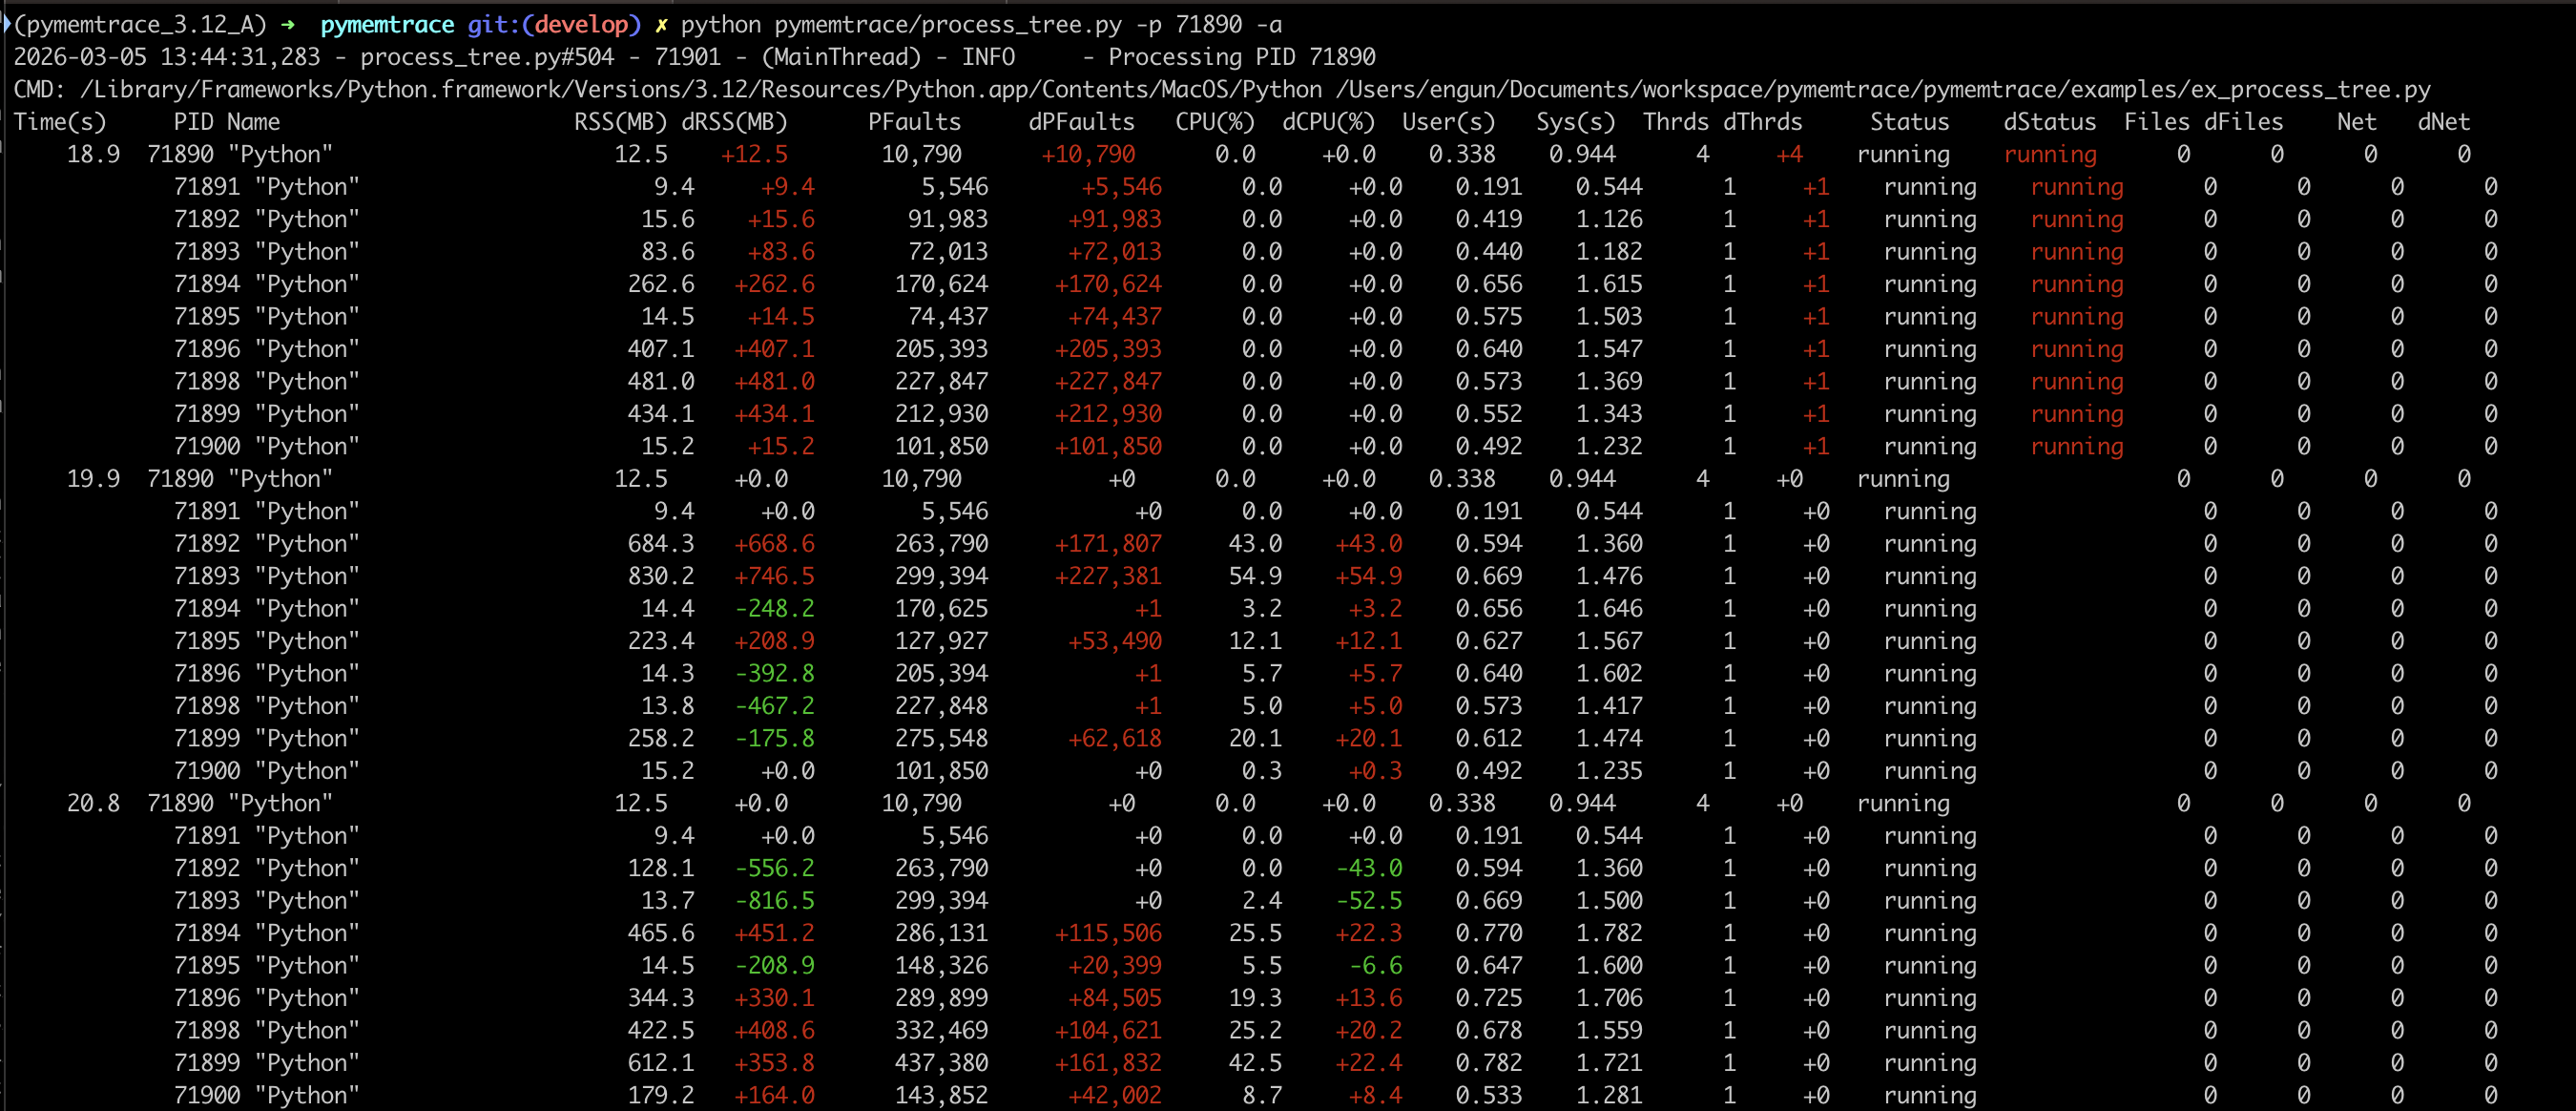
Run this and then run process_tree.py on that PID.
By default process_tree.py will just log the RSS and CPU but in this case we are using -a to output all the
measurements.
The output is colourised showing red as an increasing value and green as a decreasing value
[continued on the next page]:
Command Line Options
process_tree.py has a large number of options.
General Options
Option |
Description. |
|---|---|
|
Show this help message and exit. |
|
Logging interval in seconds [default: 1.0] |
|
The PID to monitor, -1 it is this process [default: -1] |
|
Log Level (debug=10, info=20, warning=30, error=40, critical=50) [default: 20] |
Options That Control the Output
Other options control the output of process_tree.py:
Option |
Description. |
|---|---|
|
String to use as seperator such as “|”. Default is to format as a table [default: “”] |
|
Omit the first sample. This makes the diffs a bit cleaner [default: Fals]e |
|
The USS, this is the amount of memory that would be freed if the process was terminated right now [default: False] |
|
Number of page faults [default: False] |
|
User and system time [default: False] |
|
Show number of contest switches [default: False] |
|
Show number of threads [default: False] |
|
Show the status [default: False] |
|
Show the number of open files [default: False] |
|
Show the number of network connections [default: False] |
|
Show the command line for each process (verbose) [default: False] |
|
Show typical data, equivalent to |
|
Path to a JSON file to also write the data to. [default: “”] |
Access Denied
If you do not have access rights to the process this will be shown:
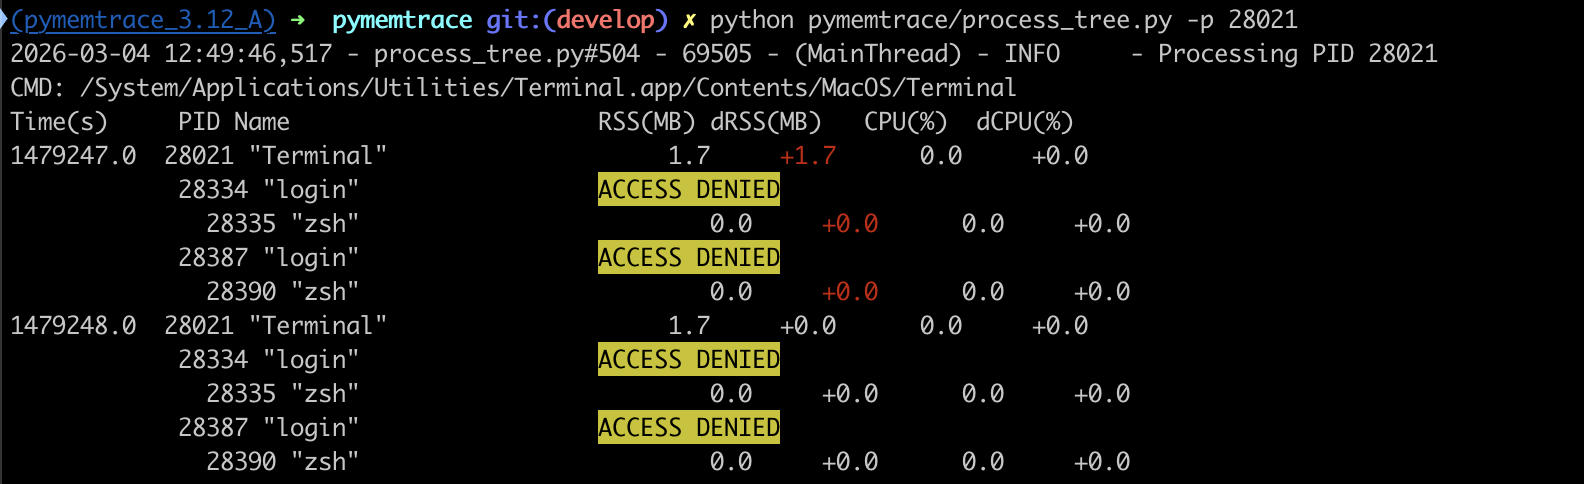
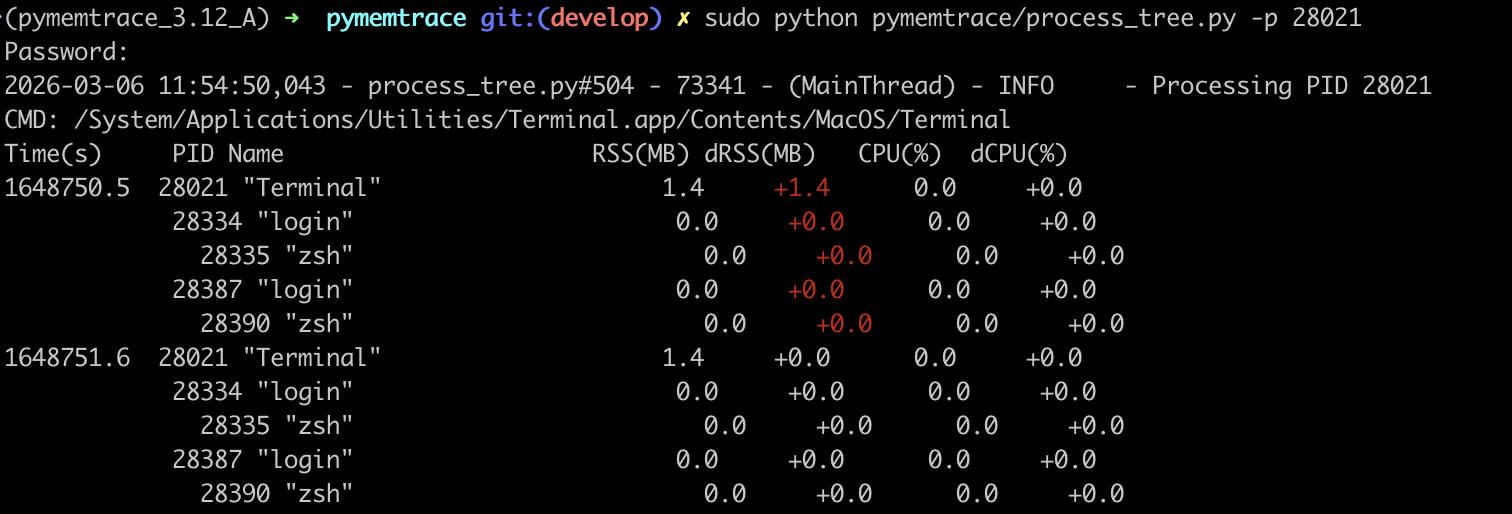
The solution is to use sudo:
JSON Output
Using the --json=... option the data will be written to a JSON file.
Here is an example of a file fragment:
[
    {
      "process_time": 1392696.8293089867,
      "pid": 28021,
      "name": "Terminal",
      "RSS": 1581056,
      "USS": -1,
      "PFaults": 352706,
      "CPU": 0.0,
      "User": 2.252103168,
      "Sys": 5.0910848,
      "Thrds": 6,
      "Status": "running",
      "Files": 12,
      "Net": 0,
      "children": [
        {
          "process_time": 1392675.2750837803,
          "pid": 28334,
          "name": "login",
          "RSS": 8192,
          "USS": -1,
          "PFaults": 1491,
          "CPU": 0.0,
          "User": 0.010427635,
          "Sys": 0.023698646,
          "Thrds": 2,
          "Status": "running",
          "Files": 1,
          "Net": 0,
          "children": [
            {
              "process_time": 1392675.2090690136,
              "pid": 28335,
              "name": "zsh",
              "RSS": 8192,
              "USS": -1,
              "PFaults": 4679,
              "CPU": 0.0,
              "User": 0.08908232,
              "Sys": 0.082339792,
              "Thrds": 1,
              "Status": "running",
              "Files": 0,
              "Net": 0,
              "children": []
            }
          ]
        }
      ]
    }
]